In part two of my series on using Microsoft Test and Lab Manager we are going to take a look at test planning.
The Testing Center Area
From a high level the testing center is where we create and execute our test plans, track our testing progress, assign builds, and determine our recommended tests.
Plan Tab
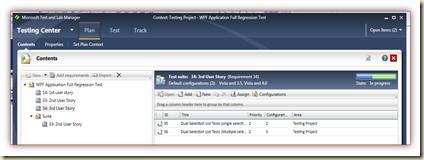
In the contents view of the plan tab we have a split screen. The left hand side is used for managing and organizing requirements. The right hand side is for managing test cases. Let’s drill into some other plan concepts before we explore the plan contents screen.
Plan - Properties
Each test plan has some properties associated to it. These properties include the test plan name and description, the TFS project it is associated to, some default test settings and configurations, build information, and some tracking info such as owner, state, and dates.
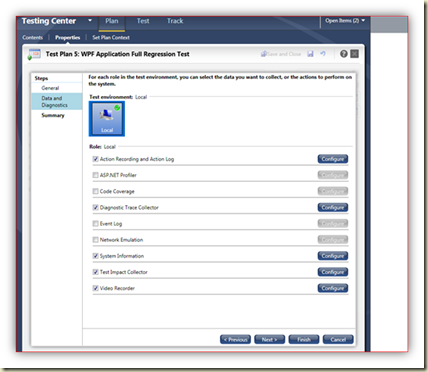
If we drill into the test settings we see the following:
The general tab is used to name and describe the settings as well as set some options regarding how the tests will be run.
The data and diagnostics tab is where we configure what we want to collect during a test run.
Action recording and log is used to record and play back the test as well as capturing a textual description of what is happening during the test. Have a look at this log the descriptions are good, we could record an exploratory type test and then copy paste entries from this log into the steps of a more specific test case.
ASP.Net profiler is used to collect asp.net performance data during a test run.
Collecting code coverage data allows us to track how much of the code we are covering during our test runs.
Diagnostic trace collector captures events and call stack information for the historical debugger.
When we collect the event log information, any new event log entry created during a test run is attached to the test run.
Network Emulation is used to emulate different qualities of network such as T1, DSL and dial up.
By collecting the system information with the test run we are attaching the OS version, amount of ram, CPU speed, and a handful of other details to our test results.
The test impact is a really cool feature. If we collect this information during a test run, TFS can tie the test to the code paths that are being executed. This information is later used during a build to allow TFS to actually suggest which tests to run. Or at development time to tell developers what tests will be impacted by changes to code. Important: we may not collect test impact data at the same time as we collect code coverage data.
Collecting the video recording will attach a video of exactly what the tester is doing during a test run. Developers can later replay this video to see exactly how a bug was produced.
Plan – Set Plan Context
This is the screen we use to manage our list of test plans and set our plan context. The list of plans in this screen is limited to all plans associated to the TFS project displayed in the title bar. Select the plan we want to work with and click the set context icon.
Plan - Contents
We find ourselves back at the plan contents screen. Remember, the context of this screen is determined by the plan we selected in the last step. We’ll explore the left side of the screen first. This is the place we select and organize user stories (requirements) and ultimately associate them to the test cases on the left hand side. I want to mention that Microsoft has introduced the notion of a suite. A suite is a generic bucket used to build a hierarchy any way we want. Think of them as folders in windows explorer, they are just used to group and associate our user stories.
To start things out we need some user stories to exist in TFS. If we bounce over to team explorer we can see an example of the default user story template. The QA team is not typically responsible for entering user stories.
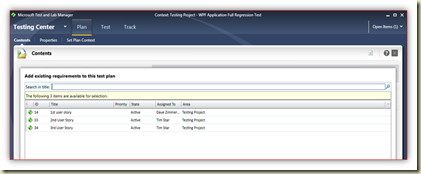
Once the user stories exist in TFS, we can click the add requirement button in the test and lab manager and we will get a list of the user stories associated to the team project.
If we select Import we can copy the user stories and test cases from an existing test plan. This copy may be individual user stories, suites (groups of user stories), or all of the stories in the entire test plan. There is even a nice feature that allows us to configure a query based suite. In a query based suite, the test case list is dynamic. As test cases are added to TFS that match the query parameters, the list of test cases in the suite will change dynamically.
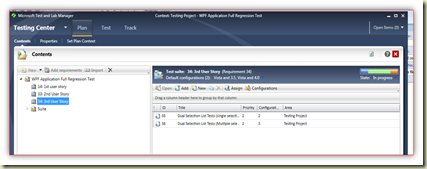
Now let’s take a look at the right hand side of the plan contents screen. This is the test case area.
From here we can add an existing test case. The following screen is used to search our TFS project for existing test cases.
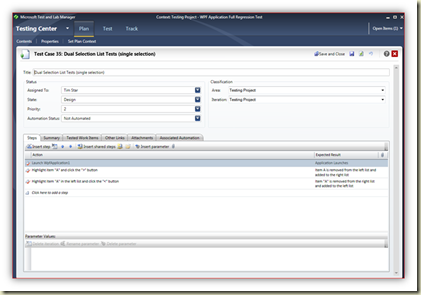
We can also add new test cases from the plan contents screen. Following is the default test case work item template. Notice at the bottom of the test case I have configured 3 steps. From here I can also configure variables for data binding and insert shared steps.
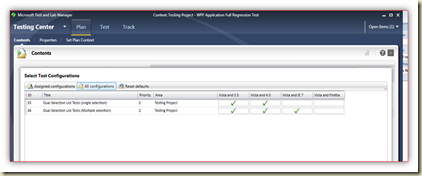
If we click on the configurations button in the plan contents screen we get the following screen. Here we configure which tests run against which configuration. In my example I have 2 test cases, the first is configured to run on; a Vista machine with the 3.5 version of the .Net framework installed and a Vista machine with the 4.0 version of the .Net framework installed. The second case runs against both of those configurations and additionally needs to run on a machine with Vista and IE7 installed. The cool thing about this is the configurations have a multiplier effect. When it comes time to execute these two test cases 5 tests will be created, one for each configuration.
The last screen I want to look at in this post is the “Assign Testers” screen. To get here we click the assign button from the test contents screen. This is where we assign TFS users to each individual test (a combination of a test case + a configuration).








No comments:
Post a Comment